

Results Reproduction (R-squared)
Results Reproduction (R-Squared) is a service that computationally reproduces the results of your research to ensure Reproducibility and Transparency – think of it as enhanced proofreading for your Data and Code.
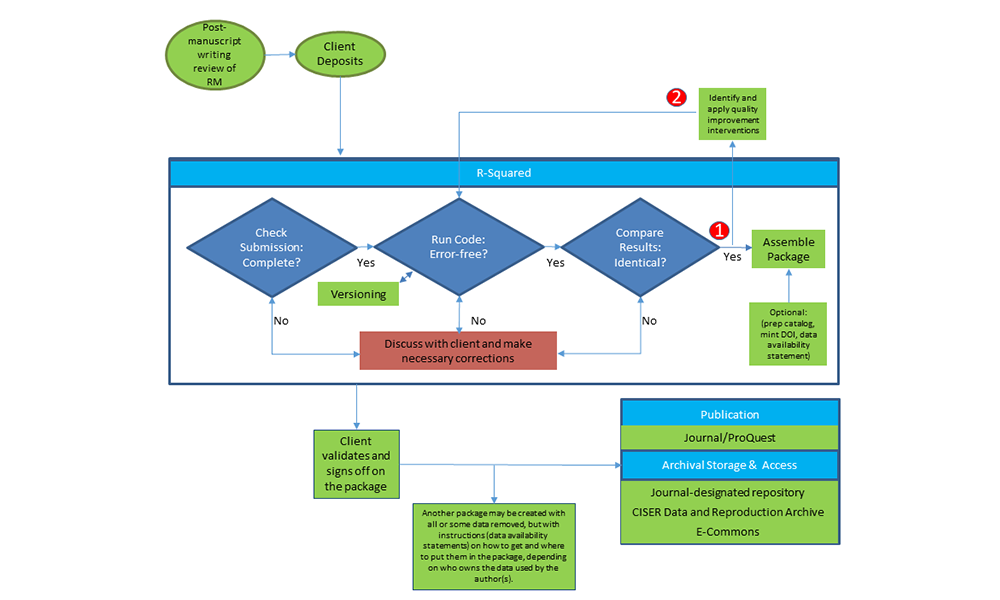
The client deposits with R-Squared. After CCSS receives the submission, we check it for completeness, run the code and compare the results making sure they are identical. Any differences we discuss with the client and fix. Then we archive it in either a journal-specified repository or in the CCSS Data & Reproduction Archive, where people can access it online.
-
Reproduces output precisely
-
Provides suggested code edits to facilitate reproduction
-
Ensures
-
Transparency and Reproducibility of your research
-
Ease of access to data and code for others
-
Independent understandability by others
-
-
Creates an archive package with all information in one place (example: https://doi.org/10.6077/zrvc-pc31)
-
Check your research methodology
-
Question or check conclusions or theories
-
Share anything before the article is published
-
Independent party review provides higher tier confirmation of
-
Transparency – understandability of your code and variables by laypeople
-
Reproducibility – ease for others or you years later
-
-
Increased discoverability and accessibility of your study
-
Ability to promptly and confidently provide reproduction materials
-
Comparative advantage in the journal review process
-
Increases the value of your publication for citation by others
-
Trusted source – CCSS is Core Trust Seal certified (see our certification)
-
Experts with years of experience in data curation, analysis, and results reproduction
-
Proven results reproduction workflow
-
The average first review takes 7 – 15 hours
-
Suggested steps taken ahead of time can reduce the time
-
Long papers with significant additional output/other factors can increase the time
-
-
We are working with CCSS leadership to scale up the R2 program and develop a sustainable funding model
-
Follow the post-manuscript writing review of reproduction materials instructions found in the Reproduction Materials Review Recommendations
-
Then share your reproduction materials via Cornell Box or sft.cornell.edu to Florio Arguillas
Each semester CCSS provides free workshops, including How to Make Your Research Transparent and Reproducible.
For more information about this workshop or the R-Squared process, contact Florio Arguillas or (607)255-7838.
To best utilize CCSS's Results Reproduction (R-squared) service, we have some recommendations for you to complete before working with us. These are optional because if you don’t have time, we will help you get them done, but that will cost more than if you do them, and these need to be completed before we can finish the project.
Part I: Manuscript
Please do the following:
- Highlight numbers, figures, and charts derived from the output generated by your code(s). This could be an in-text number (mentioned within a paragraph) or an entire table of numbers, or figures/charts. For in-text numbers, highlight only those that do not correspond to (or are not found in) tables or figures/charts produced by your code.
Importance of highlighting:- These are the tables/figures/in-text numbers that you will verify against the outputs produced by the code. It is normal to find inconsistencies, so you have to update the code and/or manuscript to reflect changes.
- After having corrected all inconsistencies between the outputs and manuscript, highlight the numbers again because you will compare them this time to the proof, and assuming no discrepancies are found, you will compare them later to the published version.
- Complete the Code-Output Checklist: code-output_checklist.xlsx. Use the code-output_checklist.xlsx file as a template. It is pre-populated with examples for reference. Remove those examples when done.
- List on the spreadsheet all Figures, Tables, and any in-text numbers that you have identified in 1 above. Identify the program and program line number(s) that created them. In-text numbers that reference numbers in tables and figures mentioned above do not need to be listed. Only in-text numbers produced by the code that corresponds to no table or figure must be listed. Later, you will run the code (following instructions in Part III – step 4 below) and indicate on this spreadsheet whether the code reproduces your results.
Importance of the Code-Output checklist:- This is your checklist to ensure that your codes can account for and reproduce all tables/figures in your manuscript.
- This is also your checklist to ensure that all in-text numbers produced by your code, but not referenced in your tables/figures above, are accounted for and reproduced by your code.
- Some of you have sophisticated programming skills or use commands that other researchers may be unfamiliar with, and this checklist will help make them/us understand.
- By completing this checklist, you also address the requirements of some journals that use this checklist when verifying the reproducibility of a study.
- List on the spreadsheet all Figures, Tables, and any in-text numbers that you have identified in 1 above. Identify the program and program line number(s) that created them. In-text numbers that reference numbers in tables and figures mentioned above do not need to be listed. Only in-text numbers produced by the code that corresponds to no table or figure must be listed. Later, you will run the code (following instructions in Part III – step 4 below) and indicate on this spreadsheet whether the code reproduces your results.
- Highlight statements on how variables were operationalized so we can check if they were correctly implemented in the code.
- Highlight claims relating to testing of model assumptions (if any), so we can verify these tests were implemented in the code.
- Highlight claims of additional analyses you did but not shown, and promise to make them available upon request, so we can verify that these were implemented in code.
- Highlight the first occurrence/mention of each dataset used in the study in the manuscript. Make sure they are cited in the reference section and the Readme file.
Part II. Data
Please do the following:
- Ensure all variables and values in your dataset are labeled and documentation related to the dataset provided (e.g., source, codebook, questionnaire if survey, etc.).
- Provide a Data Availability Statement. A data availability statement (sometimes referred to as a ‘Data Access Statement’) is crucial in signposting where the data associated with a paper is available and under what conditions the data can be accessed, including links (where applicable) to the data set. Here are sites with examples of Data Availability Statements:
It is possible, depending on the data sharing for reproducibility policy of the data provider, that your reproducibility package may not include your data, so be explicit as to where to download the files and where to put them in your reproducibility package, so researchers can download the data themselves and know where to put them. For example: “Download this from this website and put it in this on the reproducibility package.”
- Specify the license of the data. Without a license, the default would be re-users do not have the permissions to use, modify, or share your data, even if you [the creator] shared it (https://choosealicense.com/no-permission/). A standard license for open data is CC-BY 4.0 https://creativecommons.org/licenses/by/4.0/
- Do not forget to cite your data sources (including yourself if you created the dataset) in your bibliography or reference section for proper attribution. Some data providers have suggested citation language. Here are sites with examples for citing data:
- Identify the creators of the dataset, and specify contact e-mail, affiliation, ORCID numbers.
- For each data used in the study, create a sheet in the Data Metadata file (https://ciser.cornell.edu/wp-content/uploads/2021/01/Data_Metadata.xlsx) and complete all applicable fields.
Part III. Code
Please do the following:
- If more than one, specify the sequence of execution of your program files (or code) either through a readme file or preferably by prefixing the program name with Step##_.
- Create a master file to run all your codes in sequence (if you have multiple codes).
- Make sure your code has a command that opens/reads the data, so it is clear which dataset is being used (even if you only have one dataset). Use relative paths, instead of absolute paths, in your code when calling or saving files.
- AFTER YOU HAVE WRITTEN YOUR MANUSCRIPT, run your code(s) again from beginning to end in one sitting. If possible, use the statistical software package's base (or fresh) installation. Base or new software installation will allow you to detect packages and libraries needed by your code to run correctly. You may not be able to detect these required packages if you use the same computing environment because all required packages have been installed there for a while.
- Address all errors in your code found during this process.
- Ensure that all variables and values in your dataset, including those created while processing your code, are labeled.
- Check to ensure that Items from steps I.3, I.4, and I.5., if present, were implemented correctly in your code.
- Using comments, map in your code the section that created the table/figure/in-text number in your manuscript. For example, “This block of code creates Table 1”.
- Check your code comments for typos and make sure that if comments are signposting their output to locations in the manuscript, the location still exists and is correct. It is possible that tables were moved, re-arranged, or re-numbered in the manuscript during the editing process, so comments in the code should be updated.
- If it is safe to re-organize your code(s) without altering your results so that outputs appear in the same order as they are displayed in the manuscript, please do so as it would make it significantly easy, not confusing, and less prone to error when entering the results in your manuscript. If you re-organize your code(s), you may have to edit the line numbers in your code-output checklist to reflect the new locations.
- Ensure that the code saves all outputs produced. Make the code produce and save log files, if possible, especially those that produce lots of outputs, as results can be buried deep in the results window of your statistical software package and make it difficult to find.
- If you have hard-coded values in the code (i.e., values that are fixed/static or cannot be changed directly), explain why they are in the code and how they were derived. These could be values you calculated manually because you did not know how to implement the formula in your statistical software of choice.
- Comment out or remove command lines that are not necessary or not relevant in the study, especially those that produce output, as they would only increase the size of the output file and the amount of output to check.
- If your code saves outputs to a file, prefix the file name with its placement or location in the manuscript. For example, if you name the output file as summary_statistics.tex, and this output is Table 1 of your manuscript, then rename the output file as Table_1_Summary_Statistics.tex. Depending on their location in the manuscript, some files could be named Table_2_Panel_A_Column_2_Regression_model_2.tex. This would make it easy for researchers to spot the output file associated with the result in your manuscript. Notice that the filenames do not have blank spaces. Avoid naming files or folders with blank spaces.
- Identify the creators of the code, specify contact e-mail, affiliation, ORCID numbers.
- Specify the license for your code. Without a license, the default would be re-users do not have the permissions to use, modify, or share your data or code, even if you [the creator] shared it (https://choosealicense.com/no-permission/). A standard license for code is BSD-3-Clause: https://opensource.org/licenses/BSD-3-Clauseod.
- Specify the date you last updated the code and the date you last ran your analysis. These dates provide the time periods when your analysis was conducted, which are essential in determining the software version and packages/libraries/ados you have used. And do step 18 below.
- Specify in detail the computing environment you have used to run your analysis:
- Operating System and version (e.g., Windows 10, Ubuntu 18.0.4, etc.).
- Number of CPUs/Cores.
- Size of memory.
- Statistical software package(s) used in the analysis and their version.
- Packages, ado files, or libraries used in the analysis and their version.
- In R: use sessionInfo(), and packageVersion(“nameofpackage”)
Note: Do these after the program finishes or at the point in the code where all required packages have been installed. Do not do these at the start of the session, as some packages required by the analysis may not have been installed yet.
- In R for Windows, use checkpoint()package with date to ensure all required packages and versions used when the authors did the analysis are being used. Specify a folder in the checkpoint to redirect the libraries to a specific folder that can be included in the reproducibility package and called by the code using the .libPaths(“”)command.
- In Stata, redirect the sysdir set PLUScommand to a specific folder so all required ado files will be stored there and can be included in the reproducibility package.
- In R: use sessionInfo(), and packageVersion(“nameofpackage”)
- File Encoding. Specify the file encoding if necessary. Example: UTF-8.
- Estimate the time to complete processing (from beginning to end) using this computing environment.
Part IV. Output
Please do the following:
- Compare the output produced by the code with that of the manuscript. Address all inconsistencies found during this process.
- Ensure that all highlighted items on the manuscript listed in the Code-Output Checklist are in the output generated by the code. Some values in the manuscript may have been entered directly in the manuscript and not produced by the code. Explain how they were derived.
- If the software or procedure allows, make sure all output tables and figures display labeled variable names and values (if categorical).
- Highlight in the output file(s) the numbers, figures, or charts used in the manuscript. This will allow you to review and show where you got the results entered in the manuscript. Then save the output file.
Importance of the output file:
- Some researchers want to see the output produced by the code.
- Some researchers do not know how to use the software used by the authors and want to just see the output.
- To be used as a comparison file, so researchers feel comfortable that they executed the code correctly.
- Some reproducibility packages do not contain data because of Data Provider access conditions such as registration before permission to use the data is granted. Having a comparison output file makes researchers feel comfortable that they have used the same dataset as the authors and implemented the instructions correctly.
- The highlighted numbers in the output file lets researchers know exactly where the results are being pulled from.
- Some commands or libraries used in the code might be deprecated in the future due to software updates. When the code gets executed in the future, it may produce an error. Thus, the comparison output file is proof that the code worked and produced the output at some point in the past.
- Remove extraneous outputs that are not necessary and not used in the study.
Part V. Submission
Zip the manuscript, dataset, output, code, readme, and other documentation relevant to this study and send it to Florio Arguillas via sft.cornell.edu (formerly Cornell Dropbox).
- If you are using Cornell Box, share the Cornell Box folder with Florio Arguillas.
- If you are using a shared folder on the CCSS Research Server, request CCSS to give foa2_ts read-write access to the folder.
While working with you, we may request additional materials (such as questionnaires, data metadata, and other documentation). Still, the pieces we are asking for now are the baseline that we require to begin checking your work as, without them, we can’t ensure that we are checking the right values. Once we’ve verified and created your reproducibility package, we will ask you to review and validate it. This highlighted output file will be preserved and used as a Comparison Output File that researchers can compare against when using your reproducibility package.
Contact
Should you have additional questions, please contact:
Florio Arguillas, Jr. Ph.D.
Research Associate
CCSS
Cornell University
CCSS Email
607-255-7838