

Insights into tools and methods to implement your research, written by CCSS staff and Data Science Fellows!

How to Tame Text Data: An Introduction to Regular Expressions
January 17, 2023
By: Remy Stewart, CCSS Data Science Fellow
While text data has been growing in popularity within social science research, it is also a particularly challenging data type to clean, process, and extract information from. Regular expressions- commonly referred to as regexes- are a special syntax grounded in the strategy of pattern matching that enhances programmers’ ability to efficiently work with text data. This guide provides a brief overview of the power of regular expressions through examples in both Python and R.
From SPSS to R: A Personal Voyage
A personal journey from a clinical setting and SPSS to a research laboratory hands-on R.
June 6, 2022
By: Samantha De Leon Sautu, CCSS Data Science Fellow
Eight months ago, I embarked on several transitions: I moved from Panama to the United States, stopped practicing clinical medicine to pursue a Ph.D., and abandoned survey-based research to start looking at fMRI data. So far, the English language has been welcoming. The scientific principles in hospitals and labs remain the same; however, my ship for navigating data was swept from under my feet.

Read Full Post
From SPSS to R: A Personal Voyage
A personal journey from a clinical setting and SPSS to a research laboratory hands-on R.
Exploration is in our nature. We began as wanderers, and we are wanderers still. (…) We are ready at last to set sail for the stars.” – Carl Sagan
Eight months ago, I embarked on several transitions: I moved from Panama to the United States, stopped practicing clinical medicine to pursue a Ph.D., and abandoned survey-based research to start looking at fMRI data. So far, the English language has been welcoming. The scientific principles in hospitals and labs remain the same; however, my ship for navigating data was swept from under my feet.

Back home, for community research (mostly Knowledge, Attitudes, and Practices studies), I relied on SPSS (Statistical Package for Social Sciences), an IBM-owned software. In my new lab, we scrutinize our data with R, an open-source software environment. From beginner to beginner, I will share with you the first highlights of this transition in case you are interested in taking the same jump. Of course, for some researchers and students, SPSS will meet their needs.
At the station: Where is my data?
As Excel and SPSS users, we expect some sort of spreadsheet to pop up first thing upon opening an XLS, CSV, SAS, or Stata file. There is no such thing with R! It is pretty simple to display your data in this style in R, too, whether you want to see headings and a few data points or your whole matrixes.
SPPS has a user-friendly interactive interface that makes you feel like you are using one more Office program. R instead has no graphical user interface but an environment for you to input command lines.
First stop: Where are my buttons?
When coming from the land of clicks, it may be disorienting to find no drop-down menus and no buttons in R. But fear not, we have command lines instead. R is an open-source programming language with complex syntax. It is not beginner-friendly, but it will let you do better modeling and data manipulation than SPSS. Because R is used by a much larger audience and is open source, documentation and packages for endless functions are available for free online. Take my research, for example, I want to look at Heart Rate Variability (HRV), but I don’t want to code myself to eliminate outliers and unacceptable physiological values. Free access online libraries contain the RHVR package, designed for that and a lot more. I download it, install it and voila, build on the shoulder of giants.
Second stop: What do you mean, load the data?
Data management in R may make you miss SPSS. SPSS can handle all the data you have input at the same time. R requires you to load the data into the memory before command execution. Another thing you may miss from SPSS is decision trees. Such algorithms in R will require specific packages, like CART (Classification and Regression Tree), and some training.
The ride: Wow, these graphics!
Did you ever try to customize your graphs on SPSS? If you did, I feel for you. Popular R packages for data visualization are ggplot2 and R shiny. These will let you build personally tailored visualizations and even make them interactive.
The ticket: RStudio is your business class ride
R is free and open-source. To use SPSS, you must pay for a license. And the good news is that there is a way to enjoy a graphical user interface for R: RStudio. RStudio is an environment that will let you see your console, edit your syntax, view your history and manage your packages and datasets. Moreover, it will allow you to code both with R and Python language.
Destination: To self-correcting science
Both these tools for statistical data analysis have their ideal scenarios. R may bring more versatility but require a longer learning curve, while SPSS may offer a user-friendly interface more adapted for beginners. Whichever ship you choose to navigate your data, we hope you discover all its secrets and share them with us.
OpenRefine: A Lightweight Data Cleaning Tool to Add to Your Workflow
March 14, 2022
By: Aspen Russell, CCSS Data Science Fellow
When working with big data, the issue of data management and cleaning is always at the forefront. OpenRefine is a free and open source software (FOSS) to add to your toolkit which can help with data exploration, organization, and cleaning. Importantly, it’s lightweight and can export right into your Python, R, or into other data cleaning tools to help your workflow. You can even save and export your cleaning steps, which can be used for reproducibility, optimizing your process, or sharing with other researchers.
Read Full Post
OpenRefine: A Lightweight Data Cleaning Tool to Add to Your Workflow
When your research includes data, especially a lot of it, you will almost always encounter issues with data cleanliness and structure. Whether these issues are with incompleteness or inconsistencies, you probably have been in search of tools and techniques to help you fix these issues to aid in the quality of your analysis.

When your research includes data, especially a lot of it, you will almost always encounter issues with data cleanliness and structure. Whether these issues are with incompleteness or inconsistencies, you probably have been in search of tools and techniques to help you fix these issues to aid in the quality of your analysis.
OpenRefine is one of these tools.
I research online communities, which means I work with APIs quite a bit. Reddit, Facebook, YouTube, Twitter, and even a few odd ones like arXiv. Often, messy data. A lot of messy data. Most of my data cleaning and analysis happens in R or Python, but I’ve recently been adding OpenRefine into the data cleaning workflow.
In my opinion OpenRefine is a powerful tool for three reasons. First, it allows you to clearly document and export your cleaning steps. This makes reproducibility much easier and will save your sanity at the end of a project. Second, anything you do in OpenRefine can be exported into another space (like R or Python) for analysis, no headaches with proprietary file types. Even if you are a great programmer, there are situations where a tool just makes things *easier,* so having interoperability is great. Lastly, it is fast and it is free. I understand being cautious about changing your data workflow, so an addition has to add to efficiency and ease. OpenRefine doesn’t eat up a lot of time booting up and running a short list of standard checks.
What is OpenRefine?
OpenRefine, formerly Google Refine, is a free and open-source tool that is a part of Code for Science & Society. Importantly, OpenRefine isn’t for *data creation,* it is for data exploration and cleaning. If your data is local to your computer, then that’s where it stays for cleaning. OpenRefine runs as a local server on your computer.
But what does it *do*? The best definition may be the one on their website: “a powerful tool for working with messy data: cleaning it; transforming it from one format into another; and extending it with web services and external data.”
Cleaning, Transforming, and Extending Your Data
OpenRefine is powerful in that learning a few basic skills can add up quickly to tackling much more complex problems. Here are some common use cases below:
Do you need to isolate entries based on specific criteria for removal or revision? Create a text filter.
Do you need to double-check your variables are all named uniformly? Create a text facet.
Do you need to remove pesky remnants from scraped data such as links or HTML while still keeping the original data intact? Transform and select your removal criteria. One command, all of the text you want gone is now gone.
Do you need to split your data based on some criteria? Add a column and select your specific criteria to split the data (could be text or symbols for example).
Need to export your data for a particular setting? Use the templating Export feature. It defaults to JSON, but can be exported to other settings like Wikipedia! See the OpenRefine extensions for more.
Worried that you spent a long-time cleaning and have to do a similar task? Extract the operations from your last project, apply the operations to the new dataset, and you have finished cleaning!
And of course, you can always combine any and all of the above! In general, OpenRefine works best with a solid understanding of filters and facets. These allow you to isolate the data you want to explore, change, remove, or add to. I hope that the list above revealed at least one case where another tool you use is frustrating and that OpenRefine could help out.
For those who are now onboard, you may be thinking “This all sounds well and good, but what happens when you are sitting with a messy Excel sheet in front of you? Where do you even begin?”
Well, it just so happens we have a tutorial for you below!
Installation and Setup
You don’t need the internet to use OpenRefine, but you do need it to download. There are three requirements to run OpenRefine on your computer: you are running Mac/Windows/Linux, you have Java installed, and are using one of the major browsers (Chrome, Opera, Edge, etc.). Firefox does work, but can be wonky at times. There even is a Windows version with Java built-in if you don’t know the status of Java on your computer.
Go to OpenRefine.org and click download. I personally would pick a stable release that matches my operating system and go ahead and download, unzip, and open the program.
If you are running into trouble, full instructions here.
https://docs.openrefine.org/manual/installing
Extensions
Just like your browser, OpenRefine has a list of extensions that add specific functionality to this tool. Extensions to work with data with geolocation, to make your data Findable, Accessible, Interoperable, and Reusable (FAIR), and more.
There are even packages to use some of OpenRefine’s functionality in Python, R, Java, and a few other languages.
You can find extensions on the OpenRefine website under download.
Running OpenRefine
Once you have downloaded and installed OpenRefine, you will have an executable file (that blue gem icon) that you can open to start OpenRefine on your computer.
Two things will happen when you open the program. First, a command-line will open and start filling up with text. Don’t worry, this is normal. When they talk about a server running on your computer, this is that server booting up. All this means is that OpenRefine needs you to create a space, somewhere on your computer, to run the program. In this case, they want to run it in your browser. That is the second window that will open. You can safely minimize the command line window and turn your attention to your browser.
If you don’t get to spend much time in command lines, take a peek if you’re curious. You aren’t quite Neo or Trinity, but you are closer!
An Example
At this point you should have an instance of OpenRefine running on your computer. A window should appear in your web browser that is prompting you to create a project and import some data. If that didn’t happen, try copy+pasting one of these into your browser: http://127.0.0.1:3333/ or http://localhost:3333/. These addresses are where the program tells the server to setup shop in a browser.
Data
Feel free to open a data file you have on hand. You should be able to make the tutorial commands work with most datasets. Remember that OpenRefine doesn’t mess with your original file, so it is a great space to play around.
If you don’t have something on hand, here is the training data we use in workshops https://figshare.com/ndownloader/files/30848404.
This dataset is from the Studying African Farm-Led Irrigation (SAFI) database. Entries have been programmatically messed with to represent some of the more common data issues you will run into.
Your data doesn’t *have* to be local, you can also use web addresses, clipboard, database connection, or Google Data.
Browse for your file of choice and click next.
Review
This step can be a bit overwhelming, but really is just: did we import your data correctly? Are the variables correct? Did we split up the columns right? Are all of the entries there?
Below the preview window of your spreadsheet, there are a series of options that you can tweak if your preview doesn’t look right. Make sure the file type is correct and that the other minor settings line up. Most of the time this will work with no tweaking necessary, but it is always good to know what it is asking of you.
Give the project a name and a tag if you want to sort things later and hit “Create Project.”
Faceting
Now we will go through a suite of common techniques that are useful in OpenRefine, first off is one of the most important: Facets.
Basically, Facets group data by like values in a column. Then, you can manipulate the data from there. It will make more sense when you create one, so let’s do that.
- Select a column using the drop-down arrow, in this case I will use the column “village.”
- Select Facet → Text Facet as the entries are text.
- You should see a window populate with some familiar entries on the left-hand side. These are the unique entries in the column and the number of each.
- Sorting by name, an immediate problem emerges: entry inconsistency. A very common problem working with either user-collected or scraped data.
- Here you can hover over entries and edit them. This will correct the naming issue across all misnamed entries. You can also click on a set of values to inspect the other information for their entries. Click again on the entry in the Facet tab and you will return to the full dataset.
Notice that two things happened when you corrected the spelling issue. First, the data entries consolidated into one cohesive label (yay!). But the second thing that happened was that an entry was added under the “Unde/Redo” tab.
Click over and inspect how OpenRefine logs your changes. If you need to review, export, or change what steps you have taken, that’s the place to do so!
Facets are quite powerful in tandem with the logging of changes. If you have a column with a different data type, like numeric or temporal try a different type of Facet!
Clustering
While faceting is nice for viewing categories and filtering data, clustering tries to zero in on the issue of misspelling and added white space to entries, which may be misrepresenting your outputs. With a programming approach it can take a few steps to identify the likely suspects for merging and then doing the merge itself. In OpenRefine, it’s a little simpler. Let’s try some clustering:
- Within the open Text Facet you have, in our case the “village” column, click the Cluster button.
- Next, pick out a Method and Keying Function (if you are really into learning more, check out this articlehttps://docs.openrefine.org/manual/cellediting#cluster-and-edit on what all of these different methods do and which data they work best on!). For the purposes of our data, we will use the “key collision” Method and the “metaphone3” Keying Function. If you don’t know what to use, it is pretty easy to just start picking different entries and seeing if your data starts popping up.
- Check the “Merge?” box and select “Merge Selected and Recluster” to finish off the merge. Done!
Getting familiar with your data and having an internal sense of what could be wrong with it helps point you to the right feature of OpenRefine.
Transforming Data
Here is another one of those big three (clean, transform, and extend) features of OpenRefine. We are going to take a column of multiple entries and make it more analysis friendly. In our dataset, we are going to work with the “items_owned” column (go ahead and ctrl/cmd+f if you are having trouble locating it).
- Click the drop-down arrow for “items_owned” and select Edit Cells → Transform...
- A window will pop up asking you for an “expression.” The expression they are asking for is written in General Refine Expression Language or GREL. Which isn’t as technical as it sounds. We just have to write something that the computer will understand and execute. With a little practice, it will become a lot easier! In this case, we want to remove the brackets (”[” and “]”) from the entries.
- Enter value.replace(“[”, “”) into the expression box. Let’s translate this directly. value.replace should feel self-explanatory, this part says what we want to do. We could also add a value, trim entries to a certain max length, or select “end edit specific entries” (more here(https://docs.openrefine.org/manual/grel)). Okay, back to the expression. Within the parenthesis, the first set of quotes says what we are looking for and the second set says what to do with it when we find it. Here, we want to replace left brackets with nothing. Not a space, but nothing, essentially deleting it.
- Try replacing that other bracket on your own! OpenRefine has a preview window, so double-check the output looks as you expect and hit Ok.
At this point, you should have the same list of entries, but this time without pesky brackets. Now what? Well, what if we wanted to see which items are owned by a lot of people? If your answer was a Text Facet, then well done!
- Try creating a Text Facet like we did in the first example. Not quite right is it? No, there is an issue with all of the entries bundled up in each cell. That won’t work, we need to split them up.
- This time, clicking again on the drop-down for “items_owned,” select Facet → Custom text facet...
- Interesting, looks more like a transform rather than a Facet, right? Here we are once more asked for an expression and this time we want to split. Try this: value.split(”;”) and click Ok. Just like the command above, we are just asking the program “every time you see a semicolon, separate the entries.” Voila, a list of *individual* items owned.
- Create a standard Text Facet and sort by “count” to answer our original question.
GREL is very powerful, and this simple expression doesn’t scratch the surface of data massaging you can do. You can also combine multiple commands into one expression, speeding up the process!
Filtering
Here is a simple one that is used quite often: Text filter.
- Click the drop-down on a column, we will use “respondent_roof_type” and select “Text filter”.
- You should have another box on the left-hand side pop up, but this time with a search box. You can use regular expressions if you have that skill, otherwise just enter something you want to filter by, such as “mabat.”
- Make sure to check how many rows you are displaying on the top of the spreadsheet, but otherwise you should see every entry in that column with the search term you entered!
This can be a great and simple tool for performing early data exploration.
Saving/Exporting Project
OpenRefine saves as you go, so no need to obsessively check your save state as you go. In the top right of the OpenRefine window there is the option to export. You can export your project to a myriad of file types and places. You can also just export the steps you took in OpenRefine, which is great for sharing with colleagues or for open science.
The Final Word
I hope this short explanation and walk-through of OpenRefine has been helpful. If you end up using OpenRefine a lot and want to take your skills to the next level, consider pulling its functionality into a robust programming language like Python or writing scripts to automate some of the more reliable checks.
If there was one thing I want readers to take away from this overview is: don’t use Excel for data work!
Okay, there are a lot of other things, but there isn’t an excuse anymore to not use tools that are meant for data exploration, cleaning, and transforming. OpenRefine isn’t the end all be all for data cleaning, but it does many things exceptionally fast and in a transparent way and is free!
I find myself running my data through OpenRefine to get an overview of what problems it may have. It could be qualitative data that has inconsistent labeling. Or social media data that has a lot of embedded links or HTML that slipped through. I solve what I can in OpenRefine before throwing it into a dataframe in R or Python for further cleaning and/analysis. Another tool in the toolbox.
Happy cleaning!
Resource Dump + Acknowledgements
This blog post is built off of the work done by Lynda Kellam who is the Head of Research Data Services at the University of Pennsylvania. The applied aspects, like the dataset, were adapted from The Carpentries’ “OpenRefine for Social Science Data” workshop. Licensed under CC-BY 4.0.
Here are some resources for those interested in learning more:
- Data Cleaning with OpenRefine for Social Science Data
- OpenRefine User Manual
- Cleaning Data with OpenRefine (The Programming Historian)
- Fetching and Parsing Data from the Web with OpenRefine (The Programming Historian)
- Grateful Data is a fun site with many resources devoted to OpenRefine, including a nice tutorial.
Expectation vs. Reality: Cultivating Transparency in Social Science Research
March 3, 2022
By: Sabrina Porcelli, CCSS Data Science Fellow
As social scientists, we all know about the reproducibility crisis.1 We are told over and over again how numerous findings fail to replicate when existing studies are recreated by other researchers.1 This issue has driven the open science movement,2 which strives to make research more open and transparent with the goal of creating more reproducible science.
Read Full Post
Expectation vs. Reality: Cultivating Transparency in Social Science Research
As social scientists, we all know about the reproducibility crisis.1 We are told over and over again how numerous findings fail to replicate when existing studies are recreated by other researchers.1 This issue has driven the open science movement,2 which strives to make research more open and transparent with the goal of creating more reproducible science. One prominent tool that has emerged from this movement is Center for Open Science’s (COS)3 Open Science Framework (OSF).4 OSF4 is an open-source tool for developing and storing research project workflow, including data, code, and much more.

OSF offers three types of badges for research that is open: (1) open data, (2) open materials, and (3) preregistration.5,6 Open data badges are given when researchers share their data in an online repository, with one option being through the OSF platform. When sharing data openly, researchers have to be extremely cognizant of the privacy and confidentiality of their participants. Open materials badges are awarded when researchers provide materials such as measures, stimuli, or code. When sharing code openly, researchers need to write their code in a way that can be easily reproduced by other researchers, including adding comments to enhance clarity and organizing analyses in a clear and logical way. Preregistration badges are earned by providing a written record of the researcher’s plan for their research study before they actually conduct it. This can take many forms, including "AsPredicted," "OSF Prereg," and "Secondary Data Preregistration."7 While researchers should and most often do go into their projects with a plan, writing a preregistration involves taking these ideas a step further by fully outlining the key variables, measures, and plans for analyses and publishing these in an open forum.
These tasks are necessary to create greater credibility and reproducibility within social science research. Without such transparency in research practices, it is difficult to really know what went on behind the scenes compared to what is included in a final publication. However, all of these tasks can be incredibly time consuming. To incentivize researchers to engage in these practices, many social science journals have begun awarding OSF badges to publications, which are then displayed next to the article for readers to see.6 Even so, researchers may not see open science as worth the time investment or may have concerns about what to do if they need to deviate from their originally preregistered protocol.
The way the open science system is built makes it difficult to enter and intimidating to deviate from. Researchers may feel incentivized to stick to a preregistered protocol in order to uphold their initial (and public) promise regarding their study. However, this is not always what is best for a particular study. Changes in circumstances or researcher knowledge that occur throughout the research process may warrant deviations from preregistered protocols. For instance, in my own research, I worked with a team on a preregistered study exploring purpose in life and trait-urgency in relation to risky and self-destructive behavior.8,9 Our initial plan was to use either zero-inflated negative binomial or zero-inflated Poisson models to examine interactions between purpose in life and urgency in predicting behavior. However, we received advice from a statistical consultant that this may not be the best approach given the extreme skew of our data, and that we should switch to a multinomial approach where we created groups of no/low risk, moderate risk, and high risk behavior cutoffs. So, we chose to deviate from our initial protocol, which resulted in the creation of a document to track any and all deviations. Then, upon submitting our paper for review, we learned from reviewers with strong statistical knowledge in this specific area that our initial strategy of negative binomial regression would have been best, particularly when paired with a new strategy for testing interaction effects at different points within such models.10 After conducting further research into this approach, we agreed with reviewers and decided to learn this new method and completely redo our statistical analyses, which led to essentially rewriting our entire paper. This led to even more deviations and a great deal of explanation both in-text and in our deviation document.
Since I was part of a team that highly valued both open science and conducting the most appropriate analyses given our questions and variables, we all agreed to be completely transparent about every step of this process and to alter our analytic strategy multiple times for the sake of the study. However, I can imagine that not all researchers would have reacted the same way. We could have simply chosen to take our paper to a different journal, stick with the strategy suggested by the statistical consultant, and gotten the paper published as it was. Alternatively, we could have ignored the advice of the statistical consultant and stuck with our original pre-registered plan, but left out the tests of interactions at different levels of each variable, since we originally were not aware of these methods. Each change would have painted an entirely different picture of our data and would not have been in the interest of doing the best research possible. However, the process of being transparent about all of these changes was a serious struggle and immense time commitment under the previous preregistration system.
In response to such concern over protocol deviations, on December 3rd, 2021, OSF announced an update to their preregistration system which allows researchers to “transparently report changes in [their] preregistrations.”11 Previously, such transparency could only be achieved through notation within a manuscript or in supplemental materials. This additional step of determining how and when to disclose deviations may have deterred some researchers from engaging in preregistration practices at all. The shift to a modification process that is integrated into the OSF system makes it much easier to report changes to an existing preregistered protocol and may increase researchers’ willingness to engage in open science practices. This OSF update is not just a huge shift in the process of preregistration, but is also a shift in how we think of preregistration. My hope is that the shift to an integrated modification system will enable researchers to feel more comfortable both reporting changes to preregistration and choosing to make changes to begin with when the study warrants.
Another difficulty with the open science system is that researchers may be penalized for not conducting their research in the “perfect” open way in the eyes of reviewers. With the same project of my research team, we submitted our preregistration after the data was already collected due to the study being part of a larger thesis project for a master’s student. Using the "AsPredicted"12 template for preregistration, the first question asks if any data has been collected and allows “Yes, at least some data have been collected for this study already” as one answer option. However, our editor took issue with this. They felt it was difficult to know when we developed our research plan given that the data were already collected at the time of preregistration. This is a very difficult predicament to be in. We completely understood the point of our editor – it is difficult to prove when we developed our plan, and many researchers might take advantage of this option to develop a protocol after looking at their data. However, such a stringent view of preregistration brings into question whether preregistering any studies with already existing data is worthwhile and would deter a plethora of researchers from preregistering, especially any who conduct research with secondary data. In my view, preregistering at any stage is worthwhile as it allows for a record of researchers’ intent, which can then be compared to the final product. Further, research with secondary data is highly valuable, and creating transparency in such studies would be highly beneficial to any field.
As open science continues to grow, I hope it will also continue to adapt. Being open about our research should not be contingent on being “perfect.” Science is not perfect, and continuing to add this pressure and stigma to the open science process will alienate researchers from conducting open research. This will only contribute to and exacerbate the reproducibility crisis, rather than reduce it. The recent update to the OSF preregistration system is a step in a positive direction for increasing adaptability in open science. Hopefully this shift in protocol is followed by an equal shift in mindset from reviewers, journals, and other researchers so that scientists feel comfortable being open about any deviations from their existing preregistrations.
References:
- Open Science Collaboration. (2015). Estimating the reproducibility of psychological science. Science, 349(6251). https://doi.org/10.1126/science.aac4716
- United Nations Educational, Scientific and Cultural Organization. (n.d.). Open Science Movement. http://www.unesco.org/new/en/communication-and-information/portals-and-platforms/goap/open-science-movement/
- Center for Open Science. https://www.cos.io/
- Open Science Framework. https://osf.io/
- Open Science Framework. (n.d.). Badges to Acknowledge Open Practices. https://osf.io/tvyxz/wiki/home/
- Center for Open Science. (n.d.). Open Science Badges. https://www.cos.io/initiatives/badges
- Open Science Framework. (n.d.). Templates of OSF Registration Forms. https://osf.io/zab38/wiki/home/
- Ratner, K., Porcelli, S. E., & Burrow, A. L. (2021). Purpose in life, urgency, and the propensity to engage in risky and self-destructive behaviors. Motivation and Emotion. https://doi.org/10.1007/s11031-021-09915-0
- Project repository for Purpose in life, urgency, and the propensity to engage in risky and self-destructive behaviors. https://osf.io/bgcsm/
- McCabe, C. J., Halvorson, M. A., King, K. M., Cao, X., & Kim, D. S. (2020, April 8). Estimating and interpreting interaction effects in generalized linear models of binary and count data. PsyArXiv. https://doi.org/10.31234/osf.io/th94c
- Brian Nosek [@BrianNosek]. (2021, December 3). Even the best laid plans sometimes don't go as expected in reality. [Video attached][Tweet]. Twitter. https://twitter.com/briannosek/status/1466814366469218317?s=12
- AsPredicted. https://aspredicted.org/
Fine-Tuning A Transformer Language Model to Summarize Legislative Documents
March 3, 2022
By: Remy Stewart, CCSS Data Science Fellow
Milestone innovations in deep learning models for natural language processing (handling text as data) are leading the way for applying language-based AI across academic, industry, and government use cases. In this coding demo, I provide an accessible introduction to a text summation model designed to make government legislative documents more concise and simpler to read through summaries generated by machine learning.

Read Full Post
Fine-Tuning A Transformer Language Model to Summarize Legislative Documents
Check out the Google Colab notebook this post is based on here!
Documents produced across all levels of government are notoriously lengthy, can be confusingly formatted, and are often filled with legal jargon. While there's a long history of government and legal precedent that guides the creation of legislative documents, it's undeniable that said standards keep critical information about policy initiatives that can directly impact individuals' daily lives inaccessible to the general public. My research explores how technology and digital platforms are reshaping social dynamics relevant to policymaking in American cities. As a computational social scientist passionate about developing machine learning methods that have a direct social benefit for diverse stakeholders, I’ve been investigating how to use state-of-the-art tools to work towards a viable solution to this ongoing disconnect between government and the communities directly impacted by policy design.

Text summation is a specialized task within natural language processing (NLP) that can aid with streamlining government texts into more concise and simplified formats. The technique has flourished with the rise of transformer-based language models within NLP. I won’t be going too into the details of transformers within this post and instead refer you to other great resources (1, 2, 3) to learn their mechanics. In brief, transformers refer to a subset of deep learning model “architectures” that have a comparatively innovative structure regarding how the model learns the context of how language is used within a text dataset.
Transformer models trained for summation take long text passages and create original summaries of the core themes as learned from the original document. They have been used to provide accessible synopses of complex text sources such as lengthy news reports, Wikipedia articles, and academic publications. One of the many perks of transformers is that they can be accessed as downloadable pre-trained models that have been previously developed on massive text datasets through data science platforms such as Hugging Face. Hugging Face is a fantastic open-source community that provides the transformers library in Python for easy implementation of these models, as well as both model and data repositories for direct downloads4. I will therefore use an available pre-trained text summation model that I will subsequently fine-tune for the specific use case of interpreting government legislation.
BillSum is a dataset introduced by Kornilova and Eidelman5 that provides paired US Congressional documents with summaries of the proposed legislation across a range of policy topics. There are almost 19 thousand documents records that I can use for model fine-tuning. My following proof-of-concept model has a range of potential applications towards increasing the transparency of proposed legislation beyond regulatory legalese across government bodies and their various produced legislative documents.
Throughout this walkthrough, I’ll be keeping technical details brief and instead focus on the simple workflow that the transformers library in Python offers to fine-tune your own language models for a wide range of uses. We'll start by loading in our necessary libraries and the BillSum data set as publicly available from Hugging Face's data repository.
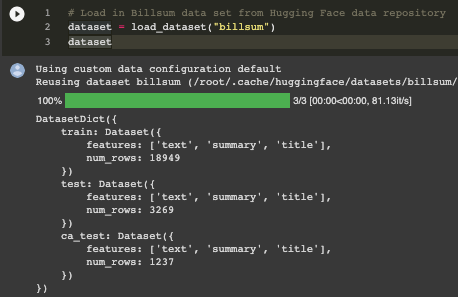
The above output demonstrates that BillSum comes loaded in pre-split with training and testing sets, referring to the core protocol within supervised machine learning of having your model first learn underlying relationships within a data set before testing its performance accuracy on unseen data. "CA_test" refers to a selection of California legislative records contrasted to the US Congress as the primary document source for training and testing. We'll focus on the congressional records for model fine-tuning and then draw from the California documents for final model testing. Let's get a closer look at one of the data records within the training dataset to understand its key features.
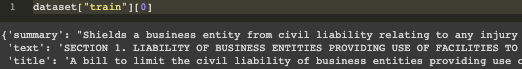
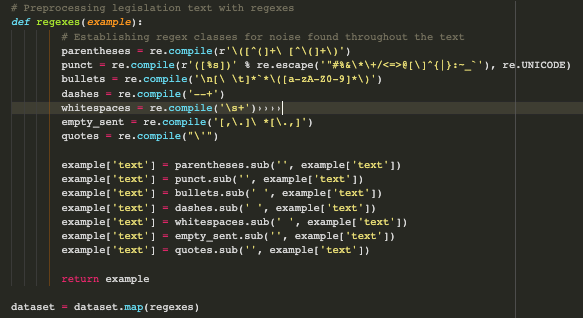
The 'text' records capture the congressional report in its entirety, while the summary focuses on the key point of business liability when working with nonprofits. These are respective the input data that the model trains on, as well as the “ground-truth” hand-written summary to compare the model’s generated summary to. There is still a fair amount of meaningless character noise throughout the full legislative document records, which is quite common when working with text data. I therefore create a function with a series of regular expressions (regexes) tailored to remove the types of noise present within the full documents such as HTML line break indicators, excessive white space, and unnecessary punctuation. While regexes can certainly look like character gibberish as well, each featured string captures specific components to remove within the text through the regex package’s sub command.
Now that our legislative bill dataset is cleaned and preprocessed into a format ready to be configured for reading into our transformer language model, let's dig more into the details of my model of choice for the text summation task at hand. I'll be fine-tuning a DistilBART model that was originally trained on a large data set featuring summaries of news articles. I'll explore two key concepts behind why DistilBART is an ideal model for building my legislative document summarizer. This includes the novel architectural strengths of original BART models as well as the advantages of distilled language models for resource-limited environments such as my own.
BART features a sequence-to-sequence (Seq2Seq) model architecture which makes the framework ideal for NLP tasks where the sequence of words is of particular importance, such as with generating sensible summary paragraphs of an input document where sentences should have a natural order with each other6. BART’s unique design allows the model to accurately create a logical sequence of what core components of the original text should be included within its generated summaries. Distillation is a technique to mitigate the computational resource demands of complex language models. The widespread creation of distilled versions of popular transformers such as with DistilBART allows these models to be used by a wider audience within the machine learning community that often have limited access to computational resources.
DistilBART requires text data to be “tokenized” – prepared within a set format- to be successfully read into the model’s starting layer of its architecture. I therefore instantiate both the DistilBART model itself and its complementary tokenizer as follows as easily provided through calls to Hugging Face’s fantastic model library.
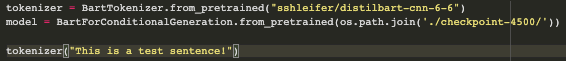
![]()
You can see via the example sentence how the input text is tokenized into respective token id values. The ‘attention_mask’ output is a binary indicator for whether the model will consider the specific token when learning its text summation task- with the sequence of 1’s meaning that all of the words are indeed included. I’ll skip delineating the tokenization process of our BillSum data due to its technicality, but for interested readers, I’ll point you to the Google Colab to learn more.
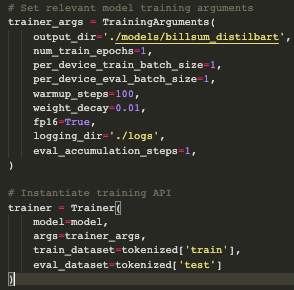
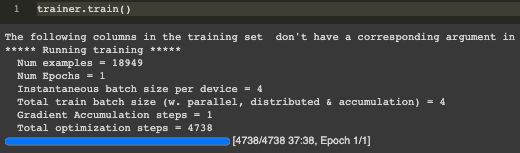
With the Billsum data set documents & summaries now prepared to be read into the DistilBART model, I instantiate both the training model and its associated arguments. Transformers as for deep learning models overall feature a range of hyperparameters, which allows data scientists to pre-determine the model’s behavior on core actions such as how many times it will conduct a complete review of the data set, how often and how much it will adjust the importance of certain components of the text for achieving its task of accurate document summation, and beyond. Hugging Face transformers come with default values for each hyperparameter, but there are a few I’d personally like to adjust as best suited for this demo. I determine those by creating a “training_args” object, and then finalize our model with its associated hyperparameters, training data, and testing data.
And with that, we're ready to train the model! Our loss metric steadily decreases across batches and obtains the lowest score on the test set, which is an encouraging sign that our model has learn how to better summarize the legislation documents across the individual records. There are specifc training metrics we can use to measure our text summation performance such as ROUGE similarity metrics7, but I'll leave exploring those to a more resource-abundant computing environments than Google Colab.
The best way to understand our fine-tuned model's performance is to directly compare its generated summaries to human-written summaries on a set of previously unseen documents. I therefore test our fine-tuned model on three legislative records sourced from the California state government. This additionally allows us to test the model's performance on documents similar to the US Congressional files it was trained on, but that also features a slightly different format and language use unique to California government compared to the federal level. After creating another function to generate model predictions as featured in the Colab file, I combine the original documents “0”, the ground-truth summaries “1”, and the generated predictions “2” into a single data frame.
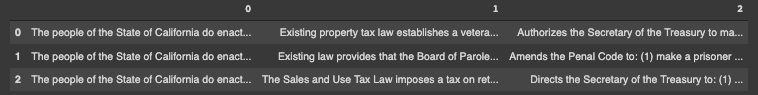
Both the legislation itself, ground-truth summaries, and the predicted summaries are quite long, so I’ll stick to just showing the initial few words for each. Overall, the model generates good-faith predictions that reflect the overarching theme of the primary legislative document. While it certainly struggles with some core points- such as missing sections of the lengthy legislation by only focusing on a few clauses within its summary- this serves as promising evidence that this framework can be built upon to craft increasingly accurate summation models. Incorporating more summation task-specific performance metrics, doing more complete passes known as epochs over the entire data set, and tinkering with hyper-parameter options would all be great next steps to improve this baseline model.
As transformer models continue to advance in accuracy and capability to handle complex NLP tasks such as generating domain-specific summaries, their potential benefits towards initiatives such as increasing government transparency and streamlining communication with the general public will become even more of a reality. These resources are becoming increasingly more accessible for data scientists as facilitated by open-source initiatives such as Hugging Face and the transformers Python library. Transformer models are undeniably powerful, and therefore must be handled with care to ensure they provide more good than collective harm as with all AI. There are many potential applications for automated document text summation, and it’s my belief that computational social scientists are in a unique position to ensure that said innovations can be cultivated and implemented for use cases aimed specifically for widespread social benefit.
References:
-
David Mimno, Melanie Walsh, and Maria Antoniak. 2022. “BERT for Humanists.” www.bertforhumanists.org/
-
Jay Alammar. 2018. “The Illustrated Transformer” jalammar.github.io/illustrated-transformer/
-
Hugging Face. 2022. “The Hugging Face Course.” huggingface.co/course/chapter1/1
-
Anastassia Kornilova and Vlad Eidelman. 2019. “BillSum: A Corpus for Automatic Summarization of US Legislation.” ACL EMNLP 2019. github.com/FiscalNote/BillSum
-
Thomas Wolf et al. 2020. “Transformers: State-of-the-Art Natural Language Processing.” ACL EMNLP 2020. github.com/huggingface/transformers
-
Mike Lewis et al. 2020. “BART: Denoising Sequence-to-Sequence Pre-training for Natural Language Generation, Translation, and Comprehension.” ACL Proceedings (58).
-
Kavita Ganesan. 2018. “ROUGE 2.0: Updated and Improved Measures for Evaluation of Summarization Tasks.” github.com/kavgan/ROUGE-2.0
Love Letter to Data: Using Computational Tools to Analyze Written Language
February 18, 2022
By: Remy Stewart, Former CCSS Data Science Fellow
As much as I love your uniqueness, text data, you’ve certainly given me a lot of headaches. When I started to specialize in natural language processing (NLP) as a researcher- referring to the use of computational tools to analyze written language- I really didn’t understand the roller-coaster relationship I was getting into. The highs are delightful, and lows are hair-pullingly frustrating. Time and time again though, I’m so glad that I’m able to work through our challenges together.

Read Full Post
Dear Data,
As much as I love your uniqueness, text data, you’ve certainly given me a lot of headaches. When I started to specialize in natural language processing (NLP) as a researcher- referring to the use of computational tools to analyze written language- I really didn’t understand the roller-coaster relationship I was getting into. The highs are delightful, and lows are hair-pullingly frustrating. Time and time again though, I’m so glad that I’m able to work through our challenges together.
I originally became interested in text as data since I saw it as a wonderful opportunity to draw from my mixed-methods research background by quantitatively analyzing language to uncover emergent qualitative themes and patterns expressed within writing. I was enthralled by the potential to incorporate innovations from data science and machine learning with classic social science methods to make new discoveries regarding human behavior and social systems. Digging into real text-based research, however, made me quickly learn the difference between the romanticism of exciting research powered by digital text data versus what it would entail to make said discoveries actually happen.
Text sourced from online platforms such as social media sites that I use within my work is often filled with unwanted noise such as HTML code, random characters, or excessive punctuation, and it therefore requires a lot of data cleaning. Natural language processing methods are often computationally complex to run, and I can’t even count the number of times my hours-long analysis ended up crashing in the end. What makes me keep coming back to text data, however, is just how wonderful it is when an analysis comes together despite all the inevitable setbacks and bugs in the code along the way. I’ve been able to learn about how individuals who use digital platforms navigate personal experiences, politics, social inequality, and community through the insights embedded in their writing. Text data and the methods that allow me to computationally process and analyze it make me lucky enough to be able to understand these perspectives from a much larger number of voices than what I’d ever be able to read just on my own.
The data we explore in the social sciences are often representations of common human experiences. I personally believe that text data is a particularly special mirror of our social world, as it’s a snapshot of a person’s own thoughts and ideas expressed through their writing. For that, text data, I promise to keep working through our rough patches together with you. I know it always ends up being so worth it in the end.
With love,
Remy
P.S. – Interested in sparking up your own special relationship with text-based data? Check out my Natural Language Processing 101 workshop this March- you can learn more about it here!
Love Letter to Data: Data Justice
February 17, 2022
By: Aishat Sadiq, Former CCSS Data Science Fellow
Growing up, “where are you from?” was the most anxiety-inducing question you could have asked me. My two Nigerian parents and I traipsed across the Caribbean and the States in my early years. My formative years were spent in predominantly white magnet schools in Texas. In name, in culture, and race, I was othered. However, this sense of otherness drove me to build community with similarly displaced and marginalized individuals, regardless of the difference of adversity. Through finding answers in every place and individual I have developed a connection with, each part of my identity is now more wholly defined in its relation to my person.

Read Full Post
Dear Data,
Growing up, “where are you from?” was the most anxiety-inducing question you could have asked me. My two Nigerian parents and I traipsed across the Caribbean and the States in my early years. My formative years were spent in predominantly white magnet schools in Texas. In name, in culture, and race, I was othered. However, this sense of otherness drove me to build community with similarly displaced and marginalized individuals, regardless of the difference of adversity. Through finding answers in every place and individual I have developed a connection with, each part of my identity is now more wholly defined in its relation to my person.
James Baldwin once said, “if I love you, I have to make you conscious of the things you don’t see.” Today, I thank you, Data Justice. Thank you for being more than words on a page, for showing me that science is made up of ALL the people who contribute to it. Thank you for being a witness to those who live within the intersections of our society. Thank you for sharing our vulnerability, our bodies, our knowledge, and our experiences with the world with humanity and care.
At times, I grow frustrated with the progress we have yet to make. As another close woman of color recently told me about a different injustice, “It’s not the best, but it’s better than nothing and it’s better than putting myself in harm just to try and prove that there’s goodness in the world.” Change moves at the pace of relationships and relationships move at the pace of trust. That change is going to take time and sustainable progress, so who am I to rush it? It’s not in my power, nor is it my duty. Because of you and the thoughtful researchers who work with you, I hope that the harm between the scientific community and marginalized people begins to mend. I hope, through time and trust, we are able to build a table for all of us to equitably share from.
Moving forward, I plan to grow deeper in my relationship with you and learn how I can better myself as a researcher and global citizen.
With love,
Aishat
Love Letter to Data: A Journey with APIs
February 16, 2022
By: Aspen Russell, Former CCSS Data Science Fellow
Our journey began with an audacious goal: to solve harassment on Twitch, a major live streaming platform. With the brash mind of an undergraduate and an abnormal training, computer science and gender studies, I started trying to find you. There were a myriad of questions that overloaded me. On a platform of billions of comments, millions of users, and thousands upon thousands of live streamers, where do I begin? Who matters, how many matter, and what features matter? You proved elusive.

Read Full Post
Dear Data,
Our journey began with an audacious goal: to solve harassment on Twitch, a major live streaming platform. With the brash mind of an undergraduate and an abnormal training, computer science and gender studies, I started trying to find you. There were a myriad of questions that overloaded me. On a platform of billions of comments, millions of users, and thousands upon thousands of live streamers, where do I begin? Who matters, how many matter, and what features matter? You proved elusive. At the time, there weren’t many examples of how to contact or work with you, let alone academic examples of your true nature. This led me down a path to various GitHub repositories and suspect developer forums. Eventually I found a way to contact you. An unofficial application programming interface (API) made by a European hobbyist. It allowed me to ask for your help. Comments, users, streamer IDs, timestamps, emojis, and more. All fractured. I chose to collect it all. I got a small sample of popular women streamers and an equivalent sample of men streamers. Based on my intuitive sense of how the internet handles gender, I dove in.
Truth be told, I wish the state I found you in was… cleaner. But I finally had someone to work with! There were so many remnants of your old home. HTML, converted emoji icons, and other strange symbols around and in between comments. Some of these issues were fixed by leaning on the hand-crafted packages created by the community around me (at the time, it felt like magic), others were annoyingly manual. Investigating word frequency, common word misspellings, stop words, and more. Trial and error. All of these steps made your form more manageable and legible. They also brought meaning and context to the almost 200,000 comments. I felt like I really understood the dynamics at play. From there I was able to refine and filter highly specific information: the most unique words for each streamer. The results were disturbing but expected. The popular women were primarily receiving comments that disparaged their bodies and abilities, whereas the men’s comments focused on entertainment value and skill.
What our journey revealed to me was the beauty in the mess. I reset my expectations, took each step iteratively, and learned to keep the limitations in mind. Imperfections are perfectly manageable if you know where they come from and why they aren’t addressed. I was able to take the fractured whole of something, the comments and metadata from sixteen streamers, and learn something from it all. Something that would be helpful to community health researchers, developers, and policy makers. I chose to use the computational approach to refine a sample for interpretive research. To me, the beauty of data-informed research is that data can reveal interesting phenomena, test a hypothesis, complement qualitative findings, and reveal spaces for qualitative inquiry. Regardless, the necessity for interpretation is clear. Data are not neutral. Our acquisition, alteration, and interpretation of them form knowledge.
With love,
Aspen
Interested in using APIs for social science research? Check out my workshop series here!
Love Letter to Data: You Can Love Your Data Too!
February 15, 2022
By: Kimberly Williamson, Former CCSS Data Science Fellow
Hey. I’m writing this letter because I think it’s finally time we talk about some things. I love you. But data… you don’t love me back the way you should. For years, I’ve said with excitement “I love data!” And I DO! I love all of the insights and decisions I can make with data! The stories we can tell together! But data, you don't reciprocate that love.

Read Full Post
Dear Data,
Hey. I’m writing this letter because I think it’s finally time we talk about some things. I love you. But data… you don’t love me back the way you should. For years, I’ve said with excitement “I love data!” And I DO! I love all of the insights and decisions I can make with data! The stories we can tell together! But data, you don't reciprocate that love. You can describe an entire society, but historically, you haven’t always included people like me. So how can I keep loving data when it does not love me back enough to represent me? How can I reconcile loving the possibilities data offer, when data doesn’t include everyone in that future? I’ve dedicated my professional career to understanding you better and leaning on you whenever my ideas needed support. I wish I had noticed earlier, that our relationship was one-sided but alas, here we are.
I’ve asked and asked, “Why can’t you see me like you see others?” How have I invested so much in you, but continue to see how I and other minoritized individuals get lifted out of a story? I’ve seen parts of you dropped because there wasn’t enough of a group to bother remembering the count. Why is the solution to ignore entire populations? I know that you have given me much, I mean c’mon, I study Information Science, I don’t hide my love for data. But somewhere along the way, I let you become a part of me and never demanded that I be a part of you. You see, relationships are mutual, reciprocal, a give and take. I’ve learned so much from you, but did I teach you too? Did I expect that you know me as much as I know you? I suppose I did expect it, but when you let me down I thought, well, [shrug] it’s hard to know me. That’s okay, I guess you tried. But I was wrong.
Because now I know, this love is one-sided. It turns out, I have all the power! I can be creative in how I collect data. I can find new methodologies that value tiny populations and reflect the complexities of our identities. I can make data see everyone. And you, and all the other researchers, can too. The first step is loving yourself and acknowledging that you belong in the data and should be included. I swallowed the old adage about “statistical significance” and forgot that those standards were created by unimaginative scholars eager to maintain the value of the “majority.” But no more! I love my complexities enough to know that we need to account for that experience in the stories we tell with data. The second step is sharing this commitment. Talking to scholars, researchers, data storytellers, and anyone else who will listen. Collaborating and cultivating interdisciplinarity to solve these holes in our data that we have long resigned to complacency. And finally, applying innovative new solutions to your data. Loving your data by making it better. So, you can do it, you can love your data too! But take the steps for your data to love everyone.
With love,
Kimberly
Love Letter to Data: A Thorny Rose
February 14, 2022
By: Claudia von Vacano, Former Executive Director, Cornell Center for Social Sciences
As I reflect upon the tumultuous love affairs you have had with others, I can’t help but think that you are a thorny rose and filled with contradictions.

Read Full Post
Dear Data,
As I reflect upon the tumultuous love affairs you have had with others, I can’t help but think that you are a thorny rose and filled with contradictions.
No one can deny your beauty—when you show yourself through visualizations, intricate networks that boggle the mind—you are most attractive. The patterns that you allow to be revealed are both utilitarian on the most basic level but also mind-blowing and lead to exciting results. I love the way you hide parts of yourself until I ask you the right sets of questions, and then you reveal the true nature of who you are. In a word, you are “complex,” but I can think of many other words to describe you, “multifaceted,” and even “two-faced."
You do anger me at times--when you allow yourself to be manipulated. To be honest, I dislike your name, plural but singular, very misleading with an air of finality and objectivity when you are truly illusive.
Well, in this letter, I aim to set you on the right path. From now on, Data, I want you to be open, have equitable distribution, equitable design, ethics, and promote justice. To be honest, you are pretty biased, and frequently you allow people to say problematic things with your backing.
You will reveal who you represent and why across different datasets and platforms. You will be designed in inclusive ways that minimize bias and maximize transparency. You will respect privacy and give yourself back to the people you drew your information from. I will not permit you to aggravate social biases, sexism, or racism. But, most importantly, you will address social injustices, not perpetuate and accentuate them.
Together, there are no limits to what we can do with a solid ethical foundation. We can introduce sound theoretical frameworks to challenge your assumptions. We can measure complex variables on a continuous interval spectrum and augment your potential through supervised deep learning models. As we decompose constructs of interest, we can model and solve major problems confronting our world.
But, Data, as others have told you, you will need to take a long hard look at yourself.
All my love,
~Claudia
P.S. Read about using data to measure hate speech.